Are you struggling to understand candlestick charts? You’re not alone! For many beginners, diving into stock trading and interpreting candlestick charts can be overwhelming. The good news? It’s easier than you think!
In this guide, we’ll break down candlestick charts into manageable pieces, helping you grasp how they work and how to incorporate them into your trading strategy. Whether you’re new to the world of share trading in Hisar or looking to sharpen your skills, by the end of this blog, you’ll have a solid understanding of how to read candlestick charts and make smarter, more informed trading decisions.
Candlestick charts are one of the most effective ways to track price movements in stock market trading. Each candlestick displays four essential prices: the open, close, high, and low. By interpreting these charts, traders can identify market trends, spot potential reversals, and pinpoint optimal buying or selling opportunities.
Understanding candlestick patterns is crucial for stock trading beginners in Hisar who want to predict future price movements. The beauty of candlestick charts lies in their ability to visually show market sentiment, making them a valuable tool for both novice and experienced traders alike. For a more in-depth look into advanced trading courses in Hisar, consider exploring our Stock Market Institute in Hisar for expert-led lessons.
What is a Candlestick Chart?
Candlestick charts are one of the most popular ways to track price movements in the stock market. Each “candlestick” represents the trading action during a specific time period. Here’s how it works:
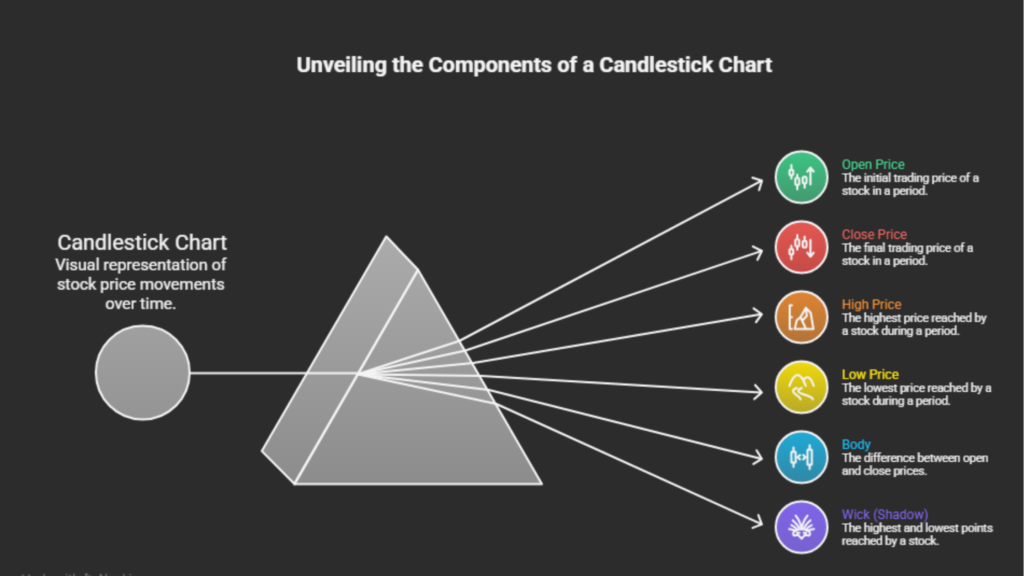
- Open Price: The price at which a stock starts trading.
- Close Price: The price at which the stock finishes trading.
- High Price: The highest price reached during that time period.
- Low Price: The lowest price during that period.
The body of the candlestick represents the difference between the open and close prices, and the wick (or shadow) shows the highest and lowest points. These charts are easy to read and provide essential insights into the market.
Why should you care about learning to read candlestick charts? Here’s why:
- Quickly Spot Trends: Candlestick charts allow you to easily see trends, helping you make better decisions about when to buy or sell.
- Easy to Understand: The visual nature of candlestick charts makes it easy for even beginners to interpret price movements and trends.
- Essential for Price Action Trading: If you’re into price action trading (where you focus on price movements rather than relying on indicators), understanding candlestick patterns is a must.
- Reveals Market Sentiment: Candlesticks give you a clear idea of whether the market is feeling bullish (optimistic) or bearish (pessimistic).
- Helps You Make Better Decisions: When you understand how to read candlestick charts, you can make more informed, confident decisions when trading.
Candlestick charts are a powerful tool for traders, helping you quickly identify trends, understand market sentiment, and make smarter trading decisions.
How Candlestick Charts Work
Alright, now that you know what candlestick charts are, let’s dive into how they work.
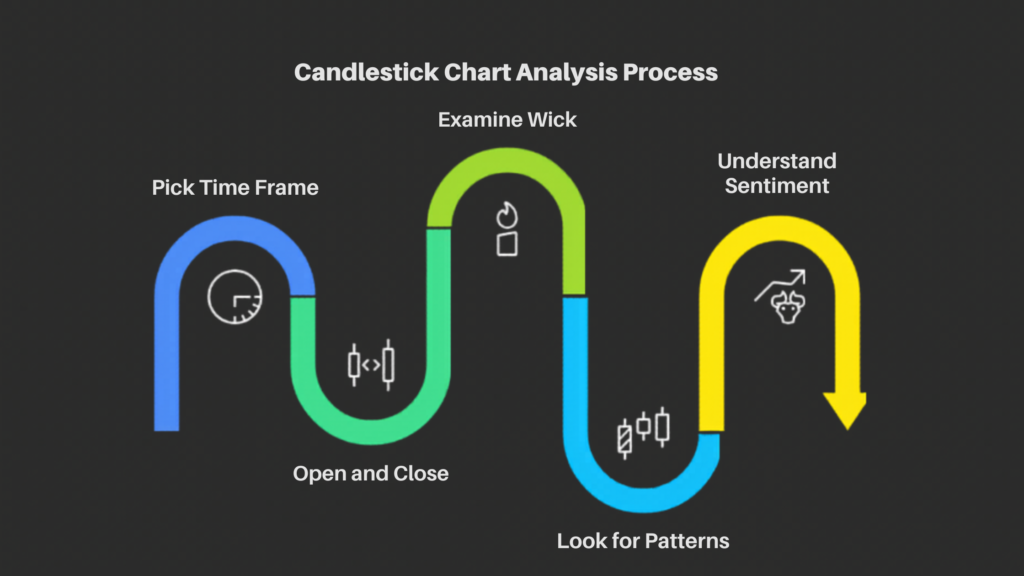
- Pick Your Time Frame: Decide how long each candlestick will represent—this could range from minutes to days. The time frame you choose depends on your trading style.
- Open and Close: The body of the candlestick shows the difference between the opening and closing prices. If the price closes higher than it opened, you’ll see a green (hollow) candlestick. If it closes lower, the candlestick will be red (filled).
- Examine the Wick: The wick (or shadow) represents the highest and lowest prices during that time period. This gives you a more detailed view of market movement.
- Look for Patterns: Candlestick patterns are formed by combinations of one or more candles. These patterns, like “doji” or “hammer,” can signal potential reversals or continuations in the market.
- Understand Market Sentiment: A series of green (bullish) candlesticks indicates an uptrend, while a series of red (bearish) candlesticks suggests a downtrend.
To read a candlestick chart, focus on the open, close, high, and low prices. Look for patterns to help you understand the market sentiment and identify trends.
Benefits of Reading Candlestick Charts
You might be wondering, “How does this help me as a trader?” Here are some reasons why candlestick charts are essential:
- Identify Reversals: Candlestick patterns can help you spot trend reversals early, so you can make smarter decisions on when to enter or exit trades.
- User-Friendly: Candlestick charts are much easier to understand compared to other complex charting methods. They provide immediate insights into market movement.
- Predict Future Price Movement: By understanding candlestick patterns, you can predict where the price might go next, helping you get in at the right time.
- Versatile Tool: Whether you’re day trading or a long-term investor, candlestick charts work for all types of traders and in different markets.
- Better Timing: They allow you to time your trades better—whether it’s a good moment to buy or when to exit a trade.
Candlestick charts give you the ability to predict price movement, identify reversals, and time your trades more accurately.
Comparison with Alternatives
There are other types of charts available for traders. Let’s see how candlestick charts stack up against them:
| Feature | Candlestick Charts | Line Charts | Bar Charts |
|---|---|---|---|
| Ease of Use | Simple to understand | Very basic, not detailed | Moderate to complex |
| Price Action Detail | High | Low | Moderate |
| Market Sentiment | Clearly visible | Not visible | Visible |
| Trend Identification | Easy to spot trends | Not ideal for trends | Good for trends |
| Pattern Recognition | Great for patterns | Poor pattern recognition | Moderate for patterns |
Candlestick charts provide a more detailed, visual way to track trends and market sentiment, making them a better choice than line or bar charts for many traders.
Who is a Good Candidate for Reading Candlestick Charts?
Candlestick charts aren’t just for professional traders—they can benefit anyone involved in stock trading, especially:
- Beginners: If you’re just starting out, candlestick charts offer a beginner-friendly way to analyze the market.
- Active Traders: Day traders, swing traders, or anyone who needs to make quick decisions will benefit from using candlestick charts.
- Technical Analysts: If you rely on chart patterns to make your trading decisions, you’ll find candlestick charts incredibly useful.
- Investors in Hisar, Haryana: Local traders in Hisar can take advantage of candlestick charts to better understand the stock market and improve their decision-making.
Whether you’re a beginner, an active trader, or a local investor in Hisar, candlestick charts are a great tool for improving your trading strategies.
Pricing Factors
So, how much does it cost to learn to read candlestick charts? Fortunately, you don’t need to break the bank:
- Free Resources: You can learn the basics for free through online videos and blogs.
- Paid Courses: If you prefer structured learning, stock trading institutes in Hisar offer courses ranging from ₹2,000 to ₹10,000.
- Trading Platforms: Platforms like Zerodha and Upstox provide free charting tools, but more advanced features might come at a cost.
Learning to read candlestick charts is affordable, with many free resources available and affordable courses for deeper learning.
Industry Trends in 2026
As we move towards 2026, candlestick charting will evolve with new technologies. Here’s what to expect:
- AI Integration: More trading platforms will use artificial intelligence to help traders analyze candlestick patterns and predict market movements.
- Automated Trading: Candlestick charts will play a role in automated trading systems that use AI to make buy/sell decisions in real-time.
- Enhanced Tools: Expect better, more advanced charting tools that make reading candlestick charts easier, faster, and more accurate.
The future of candlestick charting includes AI and automation, which will help make chart reading even more efficient and accurate.
Why Choose Mr. Trade and Stocks in Hisar, Haryana?
At Mr. Trade and Stocks, we believe in empowering traders with the skills they need to succeed. Our courses teach you everything from the basics of candlestick chart reading to advanced trading strategies.
- Tailored for Beginners: Our courses are perfect for those just starting out in the world of stock trading.
- Expert Instructors: Learn from seasoned traders who bring years of experience to the classroom.
- Hands-On Learning: Get practical experience using real-time charts and trading platforms.
- Local Advantage: Conveniently located in Hisar, Haryana, we offer courses designed for local traders.
For expert-led, practical, and beginner-friendly stock trading education, Mr. Trade and Stocks in Hisar is your go-to institute.
FAQs
1. What are candlestick charts used for?
Candlestick charts are used to analyze stock price movements, identify trends, and predict future price behavior.
2. Are candlestick charts easy to learn for beginners?
Yes, they are beginner-friendly and provide a simple, visual way to understand market action.
3. How do candlestick patterns help traders?
Candlestick patterns can signal potential trend reversals, helping traders make better entry and exit decisions.
4. What time frame should I use for candlestick charts?
It depends on your trading style. Day traders typically use shorter time frames (minutes), while long-term investors use longer ones (days or weeks).
5. Can I use candlestick charts for crypto trading?
Absolutely! Candlestick charts are used in all markets, including stocks, forex, and cryptocurrencies.
Ready to improve your stock trading skills? Enroll at Mr. Trade and Stocks today, and master candlestick charts and other essential trading techniques. Join our course in Hisar, Haryana, and start trading with confidence!